Lynnway Park: Environment
Flood exposure at Lynnway Park rises every decade and sets the flood-protection cost at both parcels. The behind-the-meter power lead is the Saugus waste-to-energy plant. Flood findings draw on the public FEMA flood-zone reference and the Arkadiah flood risk assessment (August 2026).
1. Location & coordinates
626–680 Lynnway and 0 Circle Avenue, Lynn, MA 01905. Offtake Analysis measures every distance from this point.
| Field | Value |
|---|---|
| Coordinates | 42.453064, -70.961096 |
| Address (distance origin) | 626 Lynnway Rd, Lynn, MA 01905 |
| New build parcel | 0 Circle Avenue |
| Conversion parcel | 626 Lynnway, 2nd floor |
Interactive map data © OpenStreetMap contributors. Open in Google Maps.
2. Flood lines & analysis
Evidence: the public FEMA flood-zone reference and the Arkadiah flood risk assessment (August 2026). Result: a flood-protection cost at each parcel, carried in the financial model.
Flood cost in the model. The model carries a $4.0M flood mitigation estimate for the 0 Circle Avenue new build, sized from the Arkadiah results. At 626 Lynnway the Micro Edge Data Center (MEDC) puts IT and nearly all power and cooling equipment on the leased 2nd floor, but utility service terminates at grade and the 4,160V switchgear and transformers sit on the ground floor. That electrical room carries its own flood-protection estimate of ≈ $0.40M. Assumptions §3 and Site Scenario Comparison show how both costs flow into landlord CapEx and returns.
Reading the flood line. NAVD88 is the fixed national elevation datum FEMA maps use: "feet NAVD88" is height above that datum, not above the ground or the street. BFE (Base Flood Elevation) is the water height FEMA's model expects at that spot in a 100-year flood. Critical equipment normally sits above the BFE plus a safety margin (freeboard).
- 0 Circle Avenue (parking lot, ground-up new build): a parcel-level FEMA lookup splits the parcel between Zone X (minimal hazard, no BFE) and Zone AE (Special Flood Hazard Area, BFE 14.0 ft NAVD88). Generators, UPS, batteries, transformers, switchgear and fuel systems in the AE portion must sit above 14 ft plus freeboard, or move to the Zone X portion.
- 626 Lynnway (conversion of the existing building's 2nd floor): FEMA has published no parcel-specific BFE. Arkadiah places the 626 parcel fully inside the mapped flood extent by 2050. The data hall is on the 2nd floor, so the exposure is the ground-floor electrical room and the grade-level utility tie-in, covered by the ≈ $0.40M estimate above.
Site-specific modelling. Arkadiah ran its own simulations and stress tests on the parcel, for today and for future horizons (see the full report).
Trajectory. Exposure rises every decade. 626 Lynnway is 74.9% inside the mapped flood extent today, and 626 and 680 Lynnway reach 100% by 2050. 0 Circle Avenue is clear in 2030 (0%), then reaches 6.4% by 2050 and 16.7% by 2070 in the public data, or 43.6% and 60.4% in Arkadiah's stress tests.
Probability. Each horizon maps a 1%-annual-chance event. Over a 30-year horizon that is roughly a 26% chance of at least one such event, more likely than the "once every 100 years" label suggests.
Two evidence sources, kept separate. The public MC-FRM maps (Massachusetts' official coastal flood model) show the area a 1%-annual-chance coastal flood would reach in 2030, 2050 and 2070: regulatory-grade extent, but no depth data for this parcel. Arkadiah's SFINCS simulations add seven hydrodynamic model runs that isolate individual flood drivers and test how they interact.
| Run | What it tested | Why |
|---|---|---|
| Dec 2022 historical | Coastal flooding, calibration check | Validate the model against a real observed event |
| Jul 2023 historical | Rainfall flooding, calibration check | Validate the rainfall pathway against a real event |
| 131.6 mm design-rain | An intense short rainfall alone | Isolate drainage/surface-water sensitivity |
| Current coastal screen | Present-day coastal level (FEMA 14.0 ft BFE) alone | Establish a present-day baseline |
| Current compound stress test | Coastal + rain + river flow together, today's sea level | Test how the pathways interact today |
| 2050 compound stress test | Same compound test, +0.762 m coastal level | Sensitivity check for a mid-life higher sea level |
| 2070 compound stress test | Same compound test, +1.311 m coastal level | Sensitivity check for a later-life higher sea level |
How the model works. Arkadiah rebuilt the terrain around the site from detailed elevation survey data and ran a hydrodynamic flood model, the class of tool used in coastal engineering studies, to trace where water goes rather than where a flat flood line falls on a map. The forward-looking runs hold today's rainfall and river conditions and raise only the sea level, to the height expected around 2050 and around 2070, so the depth increase between scenarios measures the effect of sea-level rise alone. They are stress tests with no probability attached; only the official 1%-annual-chance flood maps carry a stated probability. The model applies one uniform drainage rate everywhere and does not represent the site's paved surfaces or the capped former landfill underneath, both of which shed water differently from open ground.
Water depth: 626 Lynnway floods deeper than 0 Circle Avenue in every scenario (maximum modelled depth on the ground):
| Scenario | 626 Lynnway | 0 Circle Avenue |
|---|---|---|
| Current coastal screen | 2.15 m | 0.70 m |
| 2050 stress test | 3.03 m | 1.58 m |
| 2070 stress test | 3.67 m | 2.22 m |
Access floods first at the Lynnway / Commercial Street crossing, where river and road meet on the shared route into both sites.
| Scenario | At the crossing | Worst nearby point |
|---|---|---|
| Current coastal | 0.97 m | 1.58 m |
| Current compound | 1.00 m | 1.60 m |
| 2050 compound | 1.83 m | 2.43 m |
| 2070 compound | 2.45 m | 3.06 m |
Maximum modelled water depth in four scenarios: an intense short rainfall on its own, today's coastal flood level, and the stress tests that raise the coastal level to conditions expected around 2050 and 2070. Depth runs from light to dark blue/purple, under 0.1 m to over 10 m; the red marker is the project reference location.
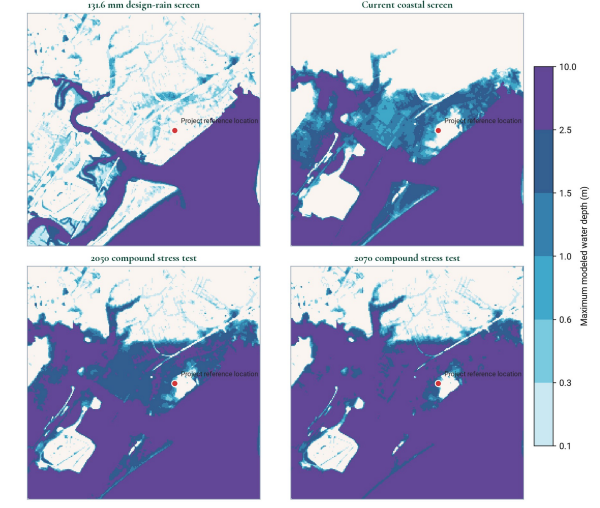
Simulation produced by Arkadiah using SFINCS hydrodynamic modelling on a 20 m grid (2021 MassGIS lidar terrain, uniform 2 mm/hour infiltration, coastal and river inputs at the southern model boundary). Screening runs for site context, not data center design depths. The 2050/2070 panels are stress tests with no assigned annual probability; only the public 1%-annual-chance coastal event carries a defined probability. The drainage network, capped former-landfill soils and final grading are not represented; the full report documents these limitations. Open the full Arkadiah flood risk assessment (PDF).
The 2050 stress test, hour by hour. The animation plays the same 2050 compound run as a 24-hour event: the approach roads and the river edge flood first, well before water reaches the higher ground at 0 Circle Avenue.
Arkadiah SFINCS 2050 compound stress test, 24-hour event. Inputs: coastal peak 5.029 m NAVD88 (the FEMA 14.0 ft / 4.267 m base flood elevation plus 0.762 m), 131.6 mm rainfall and a 12 m³/s river peak, on existing ground. Like the panels above, a stress test with no assigned annual probability and not a regulatory flood determination.
3. On-site power
The behind-the-meter lead is the WIN Waste Saugus waste-to-energy plant, 1.1 miles away. The model does not price it: the grid supplies both sites.
WIN Waste Saugus (formerly Wheelabrator), at 100 Salem Turnpike, has run since August 1985, is rated at 57.8MW nameplate and about 33MW firm, and is the second largest facility of its kind in Massachusetts (US EIA Form 860M). That firm output would cover a 6–9MW IT target several times over.
The open questions are commercial and political: whether any capacity is uncommitted, which power purchase agreements are in place, the plant's position in the regional market, and whether a private wire can cross roughly two miles of dense urban Lynn and Saugus. The plant also faces sustained local opposition over its emissions, its age and its unlined ash landfill in a protected area; tying the data center's power supply to it brings that dispute with it. Next step: test the private-wire easement first, as the likely deal-breaker.